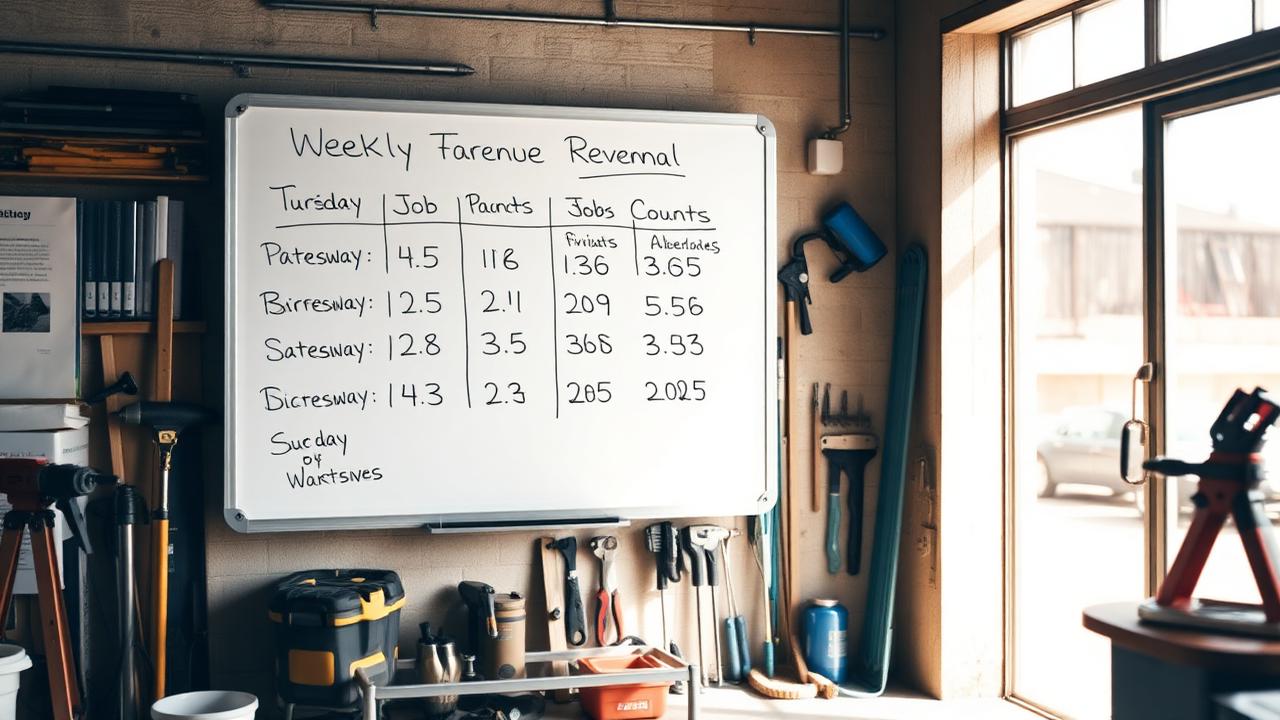
How to Track the Numbers That Matter
Four figures that tell you more about your business than a full accounting package.

Busy on paper, stuck in reality
Carla runs an HVAC service business with two techs. She's booked solid most weeks, revenue looks fine on the bank statement, and yet she can't tell you whether this quarter was actually better than last, whether her average job is growing, or how many of her customers are quietly leaving for a competitor. She has the feeling of running a healthy business without any of the numbers to confirm it.
That gap between 'feels busy' and 'is actually growing' is where a lot of small service businesses stall. You don't need a full P&L review every week — you need four numbers you can check in ten minutes that tell you which direction things are moving.
Why four numbers beat a spreadsheet nobody opens
Carla was booked at 92% capacity most weeks but her average job value had quietly dropped from $340 to $295 over six months — she'd been saying yes to smaller repair calls and turning away bigger install jobs because the calendar looked full. That one number, tracked, would have told her to raise her minimum job size months earlier. Instead she found out by accident, after leaving roughly $10,000 on the table over the period.
The point of tracking isn't the number itself — it's catching a slow drift before it becomes a real problem. A repeat rate that falls from 65% to 50% over a quarter is a $30,000-a-year problem hiding in plain sight for a business doing $200,000 in annual revenue, and it's invisible unless someone is actually watching it.
There's a version of this in every trade. A cleaning company that doesn't track cancellations might not notice that Tuesday routes have a 15% no-show rate while every other day runs under 5% — until someone actually pulls the number and finds a scheduling or communication issue specific to that route. A landscaping crew that doesn't track job duration against quoted time might be quietly losing money on every mow because the route got 20% longer as the neighborhood's trees grew in, and nobody re-quoted.
Set up tracking in four steps
You don't need new software to start. A notebook or a simple spreadsheet updated weekly beats a sophisticated dashboard nobody looks at.
- 1Calculate where you stand today on each of the four numbers below, even roughly, using last month's jobs as the baseline.
- 2Find the gap — which number is worst relative to what a healthy business in your trade should see (use the table below as a benchmark).
- 3Decide one action to move the worst number this month, rather than trying to fix all four at once.
- 4Check the number again in four weeks and adjust the action if it hasn't moved.
Average job value
The fastest lever on revenue that does not require more hours. Add up total revenue for the month and divide by number of jobs completed. Track it monthly — a slow decline usually means you're saying yes to more small jobs than big ones, often without noticing.
It's worth breaking this number down by job type if you offer more than one service. A pressure washing business might see its blended average job value holding steady at $220 while driveway-only jobs (lower margin, more of them) are quietly crowding out full-exterior washes (higher margin, fewer of them). The blended number can look fine while the mix underneath is getting worse.
Repeat rate
How many customers come back tells you whether growth will compound or whether you're refilling the same leaky bucket every month. Calculate it as: customers who booked again within your normal service interval, divided by total customers served in the prior period.
Collection rate
Revenue you never collect is not revenue. Track total invoiced versus total actually paid within 30 days. A collection rate under 90% usually means your payment process — not your customers — is the problem.
Review rate
How often a finished job turns into public proof. Divide reviews received by jobs completed in the same period. This number predicts how easily your next 10 customers will find and trust you.
| Metric | Watch-out level | Healthy range |
|---|---|---|
| Average job value trend | Falling 2+ months in a row | Flat or rising |
| Repeat rate | Below 40% | 55-70%+ |
| Collection rate (30 days) | Below 85% | 95%+ |
| Review rate | Below 10% | 25-40% |
A fifth number worth adding: cost per booked job
Once the first four are habit, add cost per booked job — total marketing and lead-gen spend for the month, divided by number of jobs actually booked from it. It's the number that tells you whether a marketing channel is actually working or just generating activity. A landscaper spending $400 a month on ads that produce 4 booked jobs at $300 average value is spending $100 to earn $300 — fine, but not great, and worth comparing against a referral channel that might cost nothing and convert at a much higher rate.
Watch the trend, not the snapshot
One bad month rarely means anything. A number that moves the same direction for three months in a row is the one worth acting on — that's the difference between noise and a real signal.
Where to keep the numbers so you'll actually check them
The system matters less than the habit, but a few things make it more likely you'll actually keep it up: keep all four numbers on a single page or screen (not scattered across three tools), calculate them on the same day every month so it becomes routine, and write the number down even when it's bad — a log with gaps in the bad months is far less useful than a complete one.
Common mistakes to avoid
- Tracking revenue only and ignoring average job value, repeat rate, collection rate and review rate
- Reacting to a single bad month instead of watching for a three-month trend
- Never comparing your numbers to a realistic benchmark for your trade
- Letting the calendar 'looking full' substitute for actually checking whether job value is holding up
- Collecting the data but never deciding on an action when a number slips
- Only looking at a blended average job value instead of breaking it down by service type
- Not tracking cost per booked job, so a weak marketing channel keeps getting funded out of habit
Common questions
- How often should I check these numbers?
- Monthly is enough for most small service businesses — weekly if you're actively working on fixing one of them.
- What if I don't track any of this today — where do I start?
- Start with collection rate and repeat rate. They're the fastest to calculate from data you almost certainly already have (invoices and job history).
- Do I need accounting software to do this?
- No — a spreadsheet with job date, customer, amount, paid status and a repeat flag is enough to calculate all four numbers by hand each month.
- Should I track these numbers by service type if I offer more than one?
- Yes if you can — a blended average can hide a shift in your job mix that a single overall number won't reveal.
Try this today
- Calculate your average job value for last month using your last 20-30 invoices
- Calculate your repeat rate for the same period
- Check your collection rate — how much invoiced revenue is still unpaid past 30 days
- Pick the single worst number and choose one action to move it this month
- Break down average job value by service type if you offer more than one
- Put a recurring monthly reminder on your calendar to recheck all four
See your numbers in one place, automatically
Track revenue, repeat customers and collections against your weekly goal without building a spreadsheet.
Open the Growth Hub- Revenue engine
See booked revenue against your weekly goal and what's still on the table.
- Growth Hub
Your weekly goal, growth plan and customer opportunities in one place.